
The Real Edge Needs Distributional Skills
|
T.R.E.N.D.S. The Real Edge Needs Distributional Skills |
|
|
![]()
We need trends to survive. Both in life and trading.
But how
to identify trends?
Below you can find my
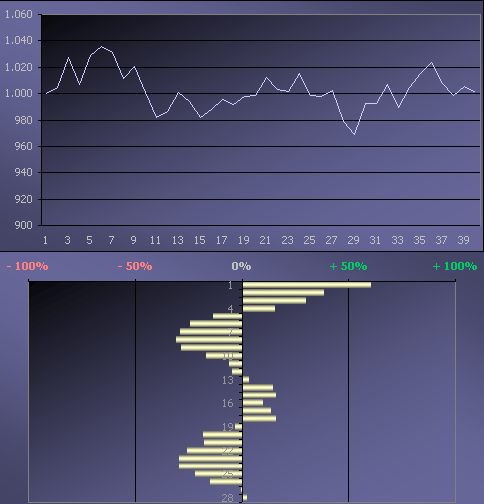
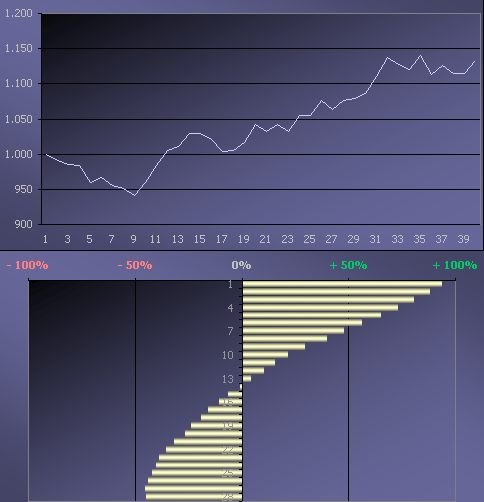
![]() trend indicator (yellow columns) which is quantifying the importance of
a trend component in a time series, i.e. the statistical significance of persistence.
The indicator is calculated with a VBA function (Microsoft Visual Basic for Applications) in Microsoft Excel.
trend indicator (yellow columns) which is quantifying the importance of
a trend component in a time series, i.e. the statistical significance of persistence.
The indicator is calculated with a VBA function (Microsoft Visual Basic for Applications) in Microsoft Excel.
The trend indicator is based on advanced statistics applied
over different time frames, and can range from 0 for no importance to 1 if the series is pure trend.
-
In sideways markets the mentioned trend statistic is erratic
and inconsistent (as a result R squared is low).
-
In trending markets the trend statistic is stable
and consistent (as a result R squared is high).
| sideways market (stay out) | trending market (get in) | |
 |
 |
Some synonyms:
We should have a method to distinguish between
- random drifts and trends
- noise and trends
- random events/fluctuations/trends and significant
events/fluctuations/trends
- random variation and "true" variation
- deterministic trend and stochastic trend processes
- coincidence and significance
R squared:
R squared (also often referred to as
R², correlation, or coefficient of
determination) is a goodness-of-fit parameter which measures how perfectly a
curve resembles a straight line with no jiggles.
The higher the R squared, the smoother the curve and so the better/desirable the
fit.
Rsquared
can range from 0 for no importance (erratic)
to 1 if the series is pure trend (stable).
A R2 value of about .33 indicates that 33% of the variance in the stock return can
be explained by the data model.
The rest of the stock's variance is due to factors other than the data model.
Beware: R2 is a descriptive measure only for the goodness-of-fit, it is no measure for
the quality of the estimation.
So this is a statistical method to identify trending and nontrending (mean reverting) financial time series.
![]()
© Copyright:
|
All rights reserved.
|
|